Last updated: August (2026)
Why this article exists
We have run ozbroadbandreview.com since August 2004. As of August 2026 our database holds more than 1,250 active reviews from Australian broadband users. Every reviewer told us what plan they were on, what they paid, what tech they had, and how they felt about it.
That dataset is the longest continuous record of household Australian broadband we know about. ACCC reports go back about a decade. RBA telecoms data is wholesale focused. Nobody else has 22 years of household level prices, plans, and ratings in one place.
This article distils the dataset into four numbers: what we paid, how fast it was, how much data we were allowed to use, and how we felt about it. Each one tells a different part of the same story.
One more reason this record matters now: in June 2026 the ACCC wound up its Measuring Broadband Australia program, which had been the only independent ongoing measurement of real world Australian broadband performance. From here, long running first party datasets like this one, and the live numbers on our broadband statistics page, are pretty much the only continuous public record left.
The four headline findings
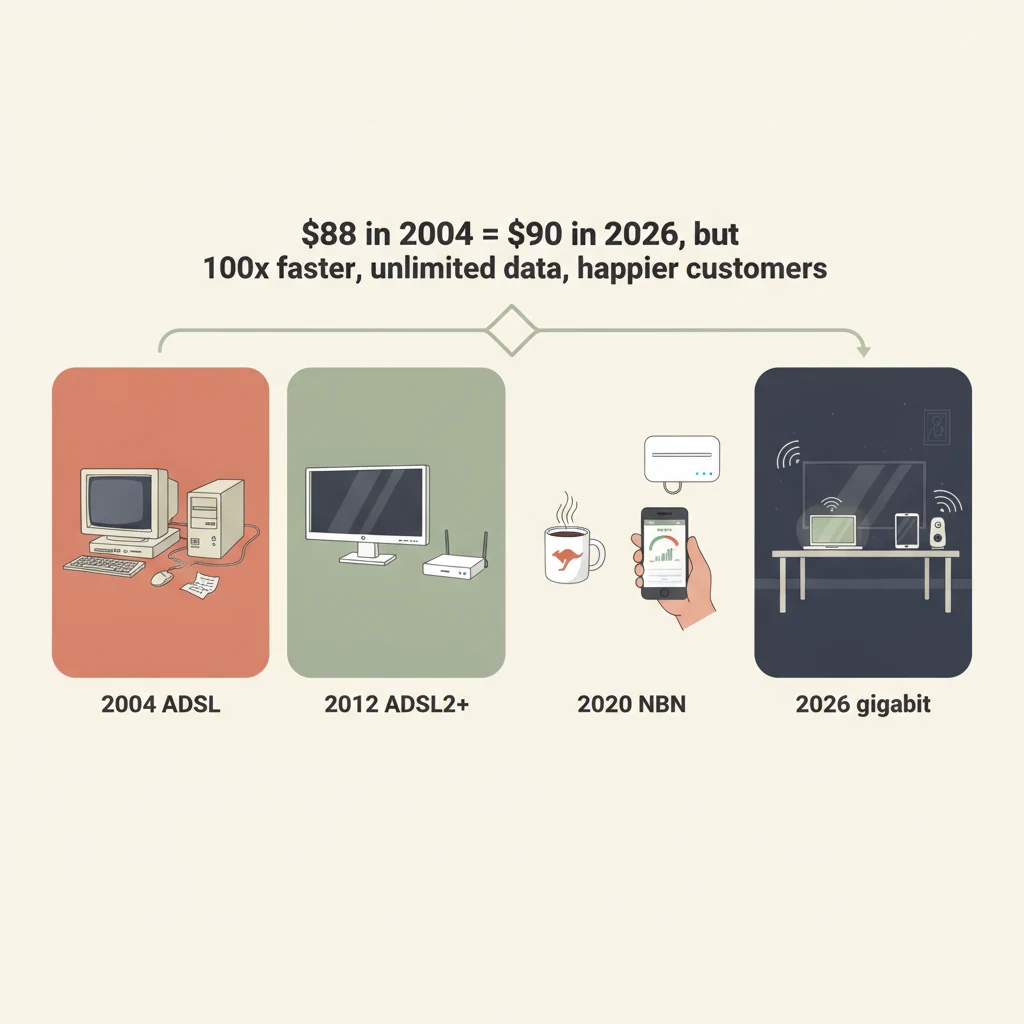
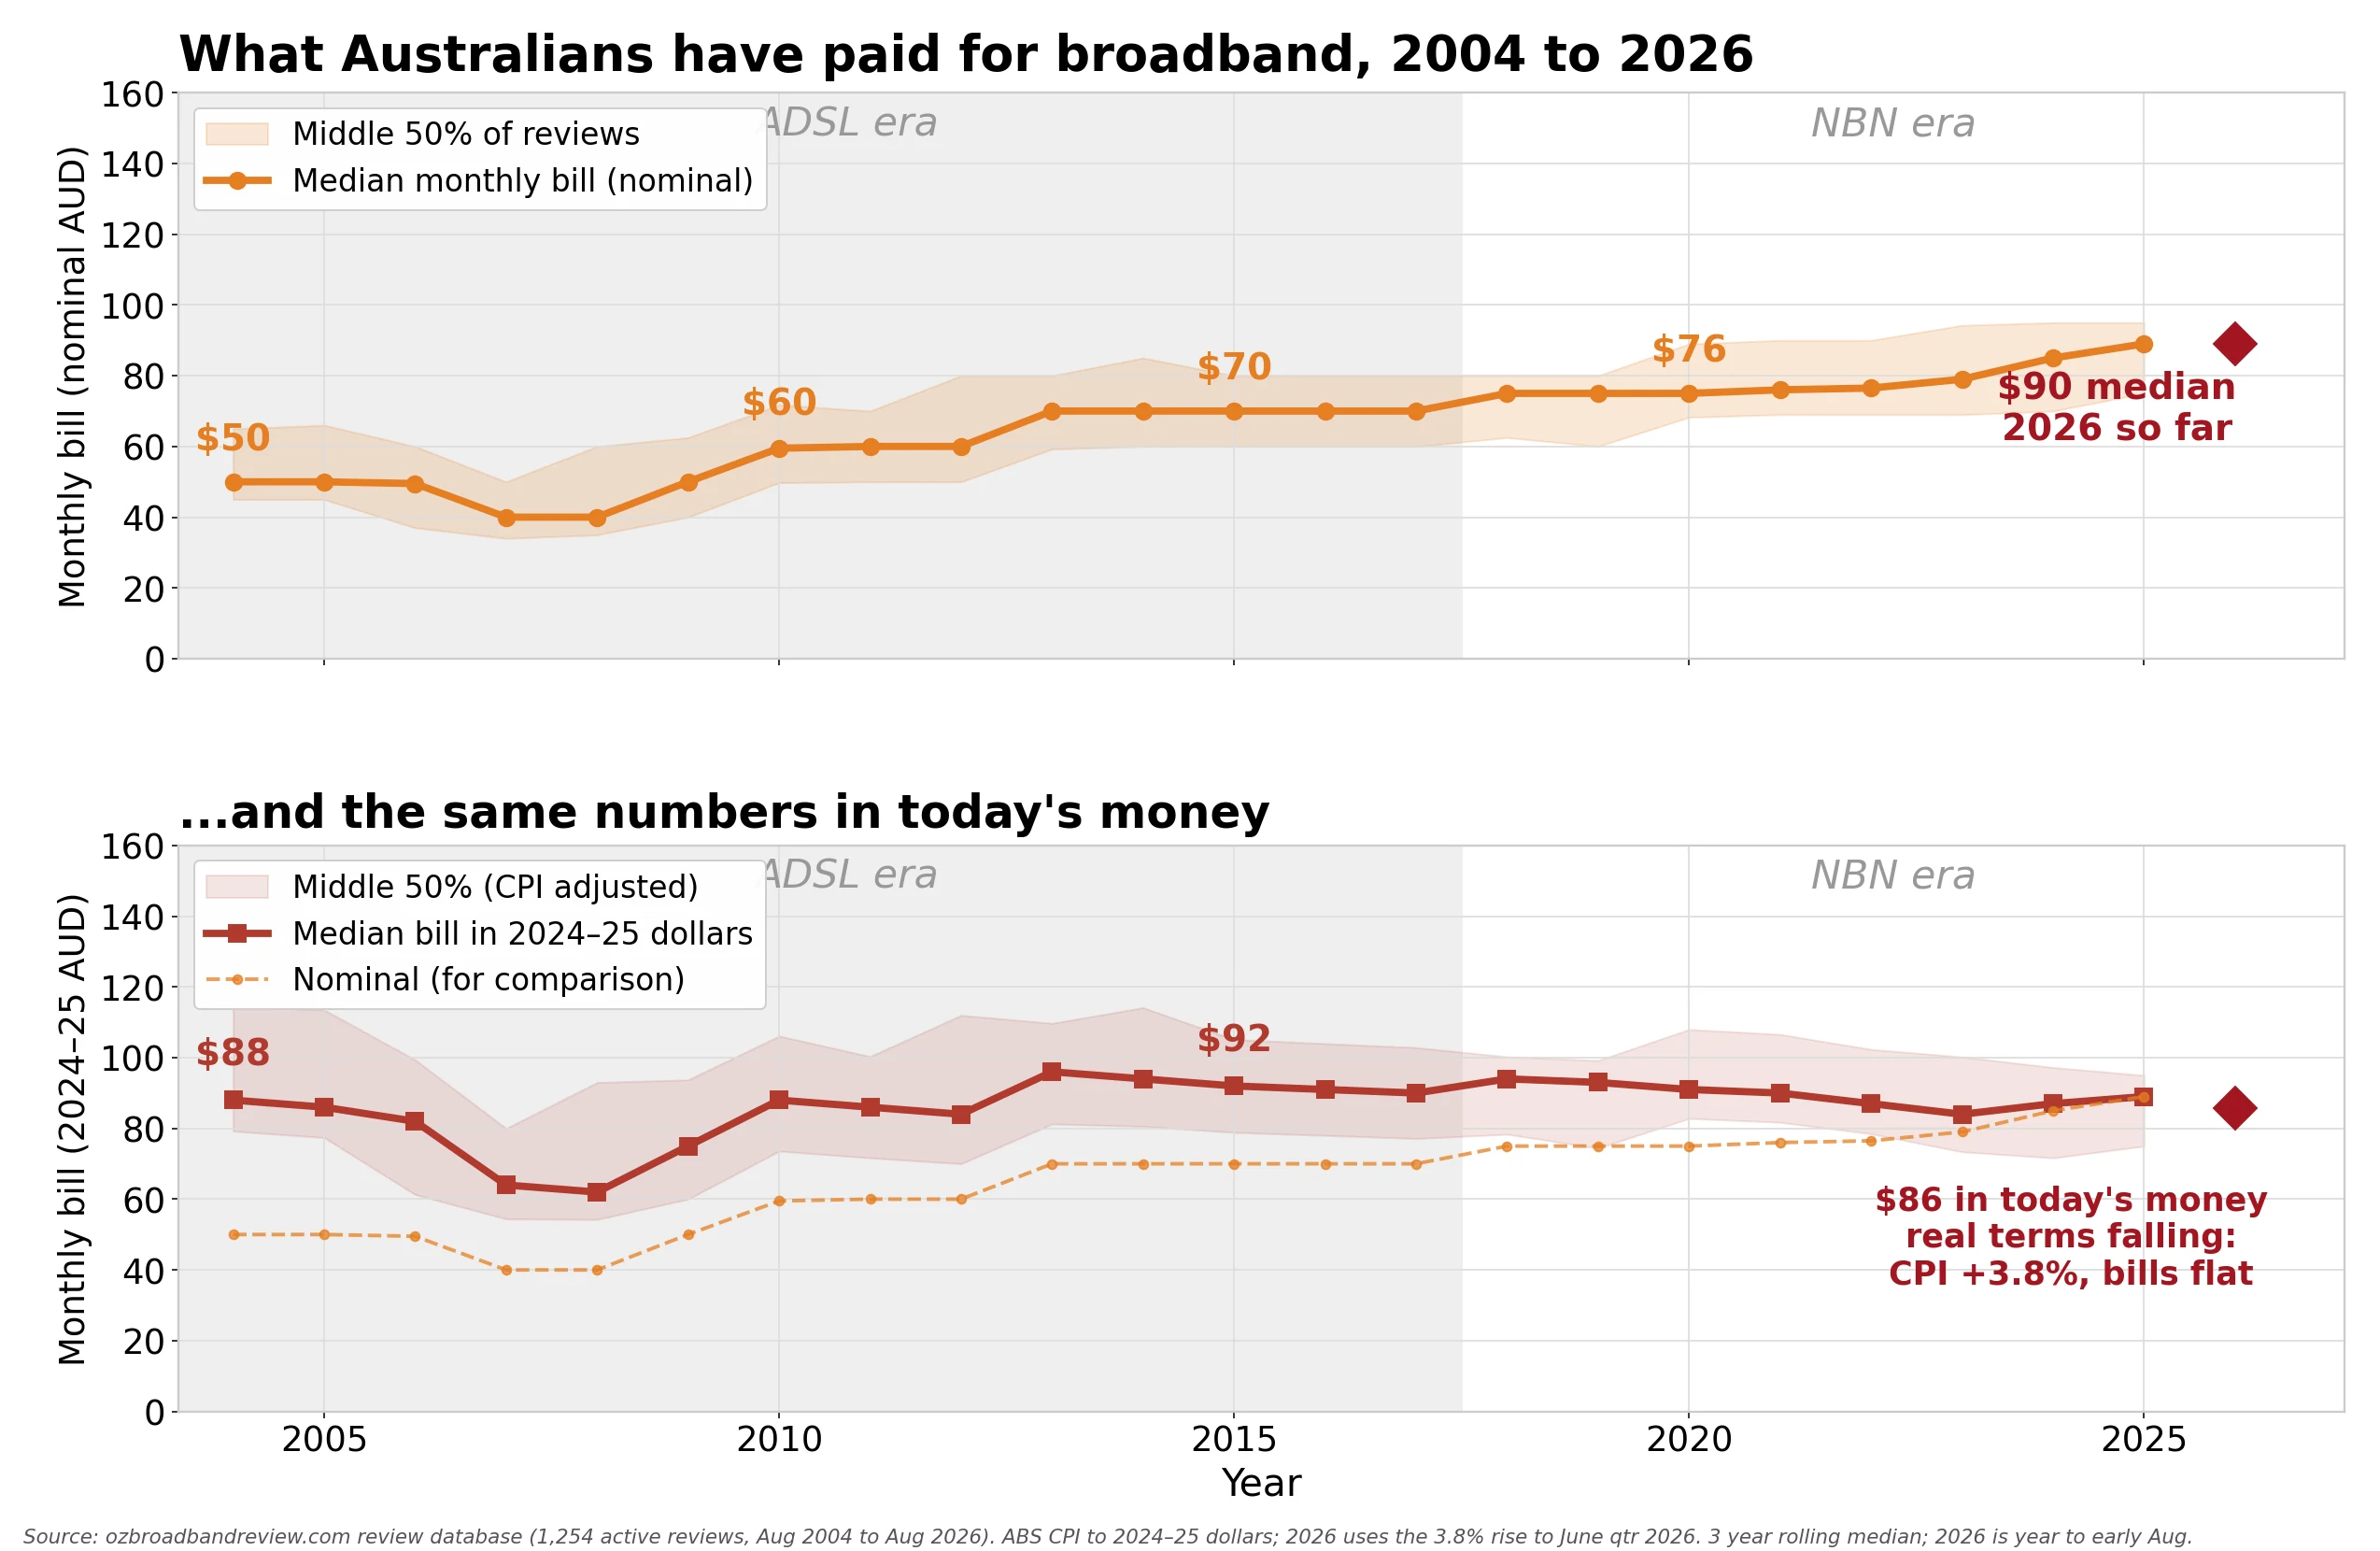
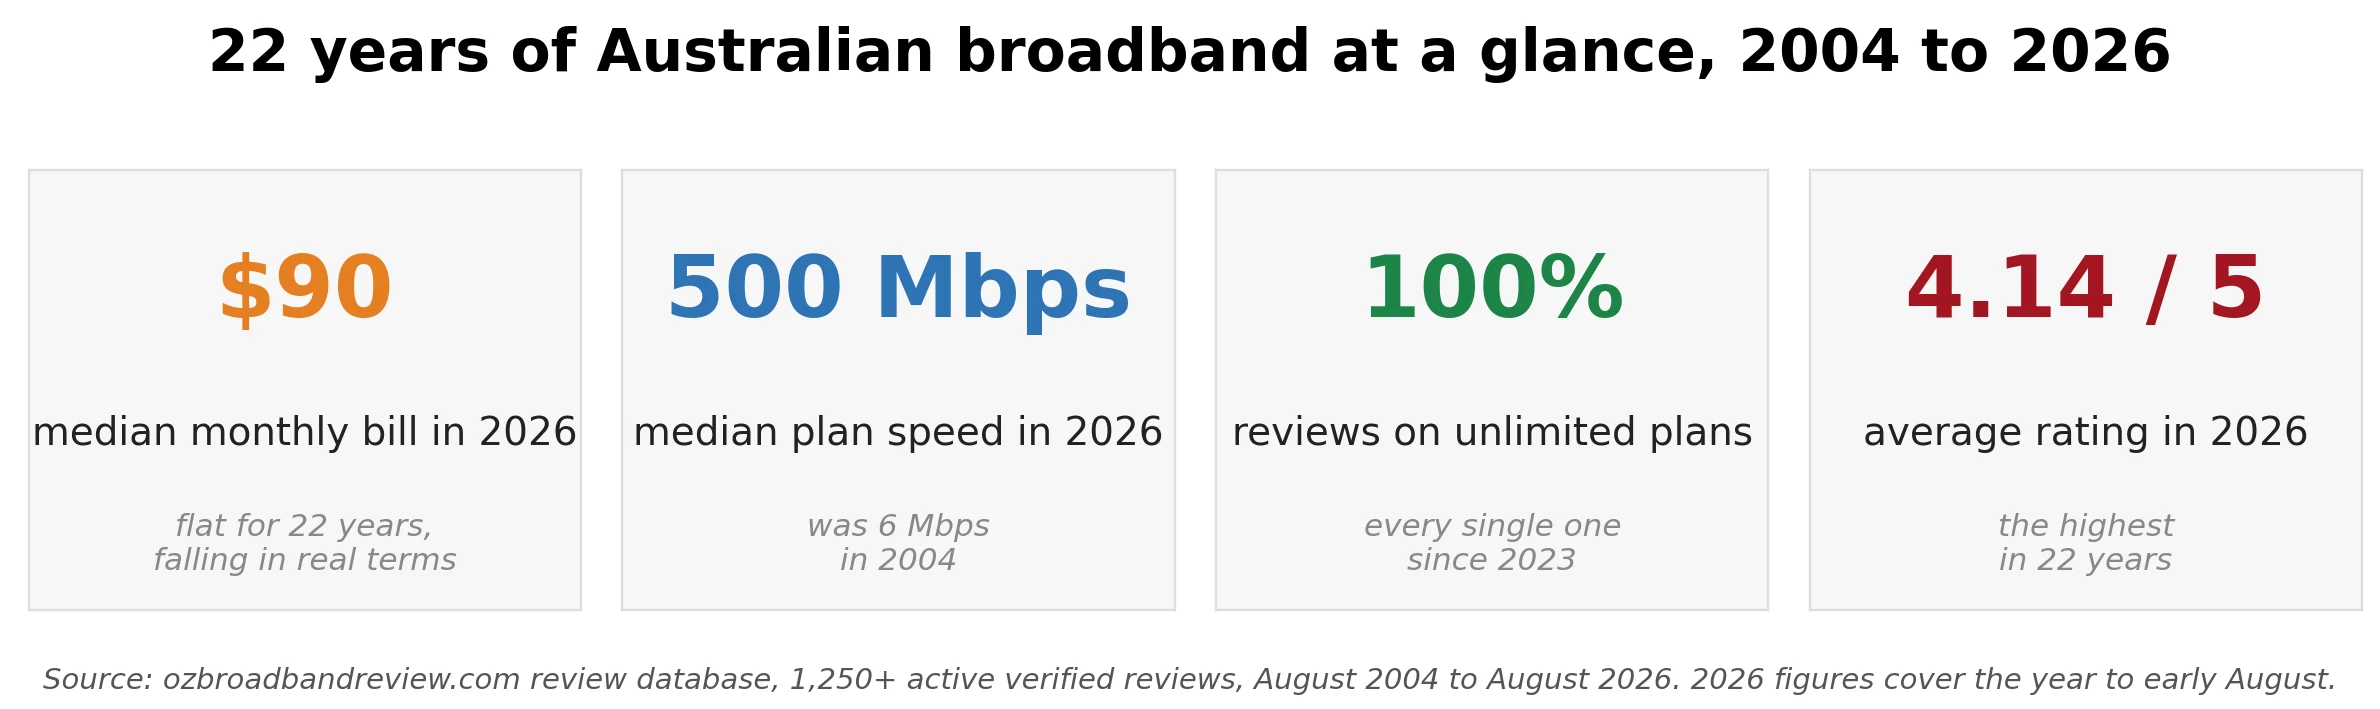
Cost is flat in real terms. Nominal monthly bill went from $50 in 2004 to $90 in 2026. Once you adjust for inflation using ABS Catalogue 6401.0, the 2004 bill is worth about $88 in today’s dollars. Real prices have not moved in 22 years, and right now they are falling: CPI rose 3.8% over the year to June 2026 while the median bill barely moved.
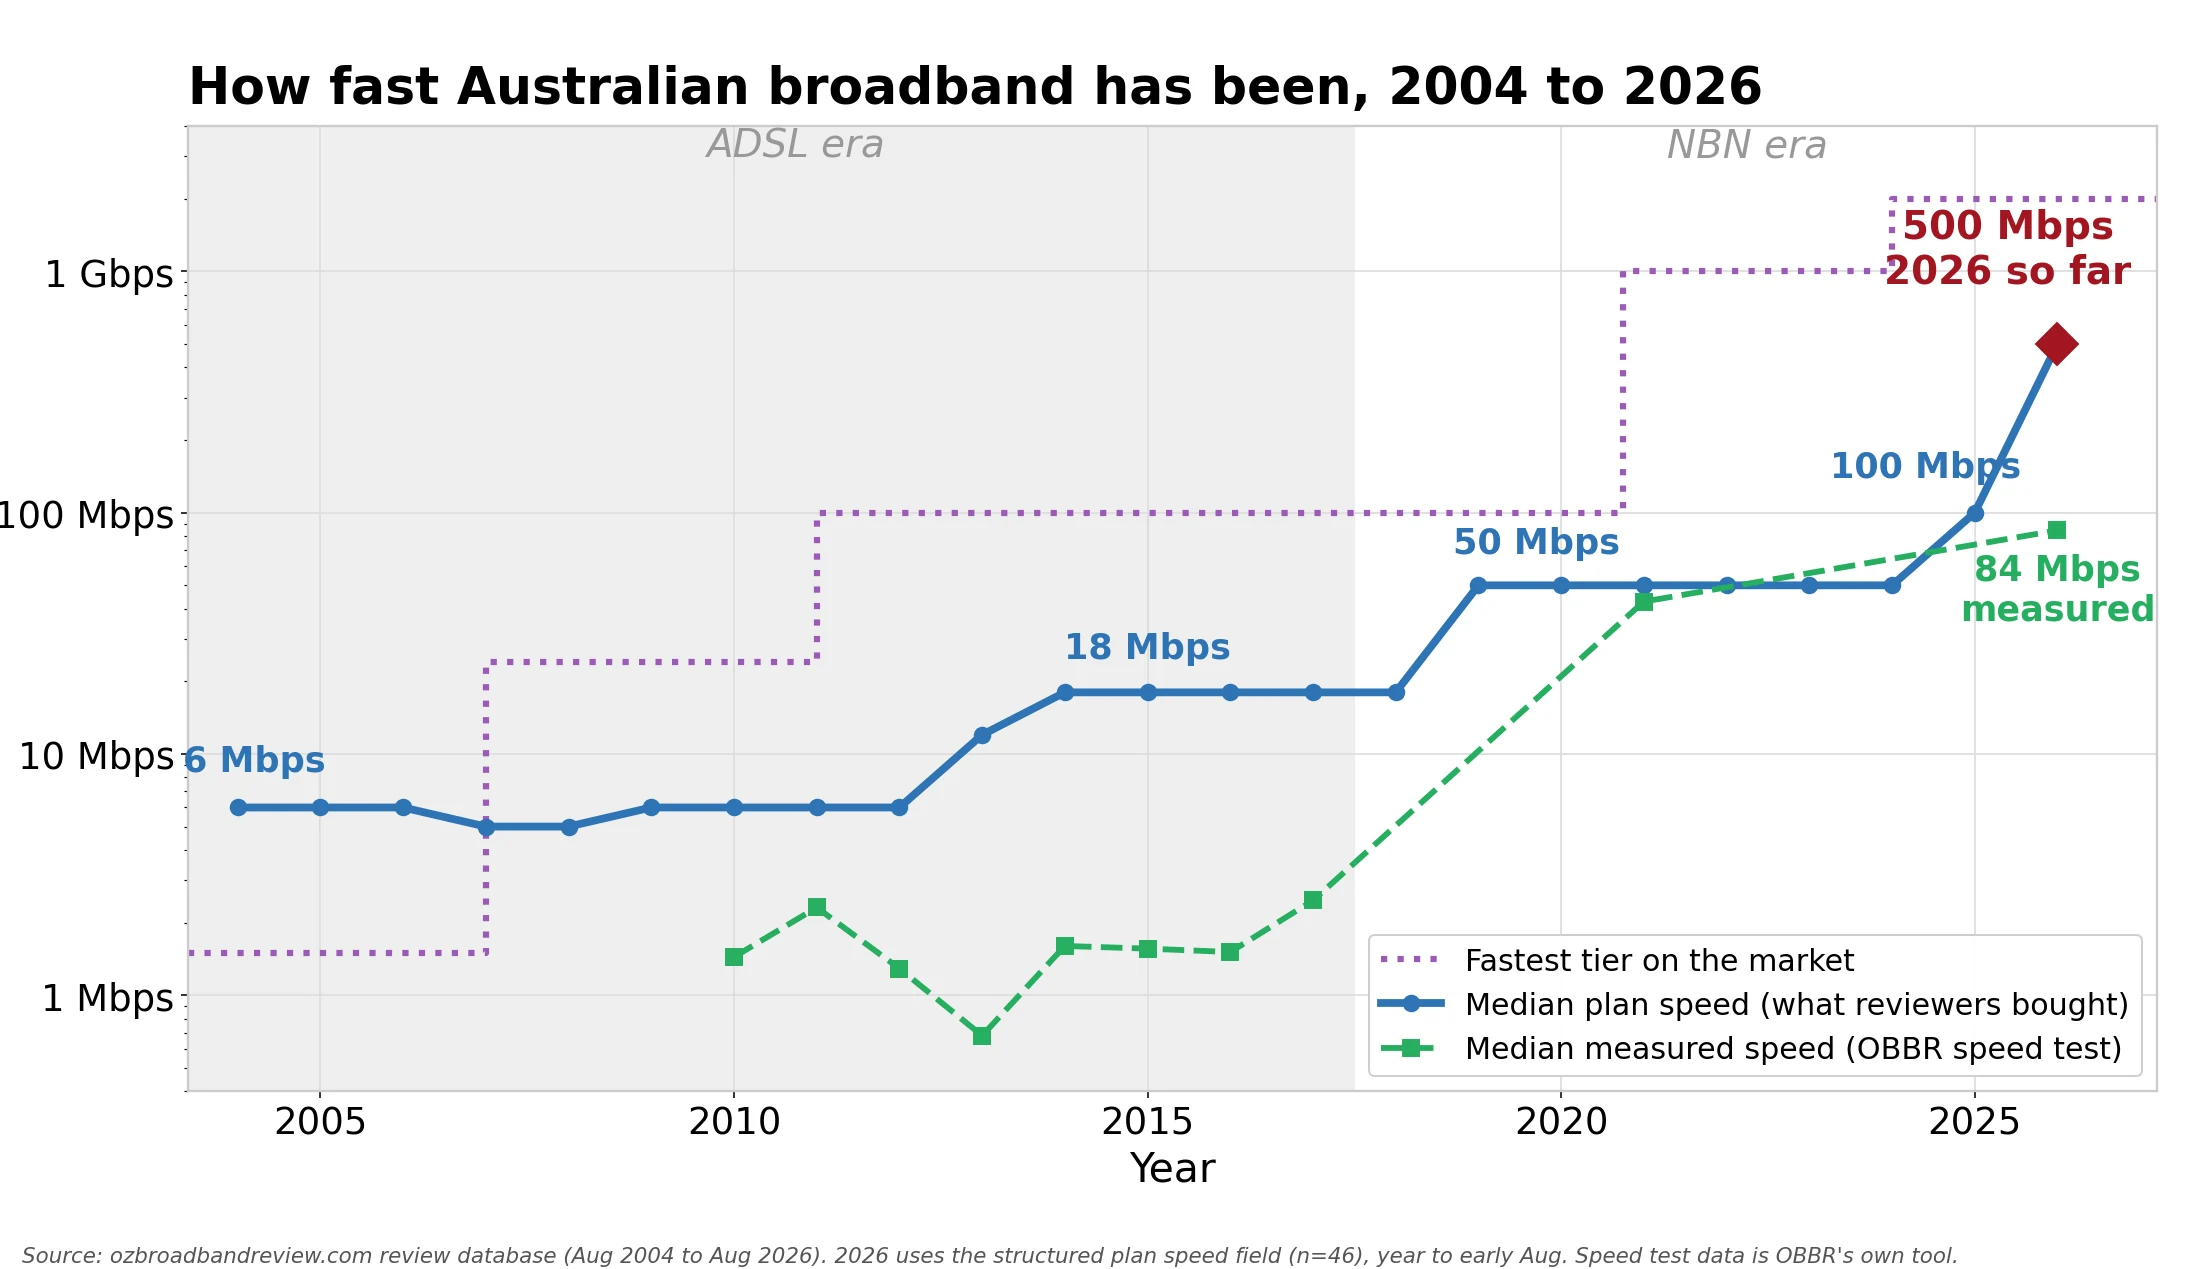
Speed went up 16 times in 21 years, then five times more in one. The median plan in our reviews went from 6 Mbps in 2004 to 100 Mbps in 2025, and the 2026 reviews so far have a median plan speed of 500 Mbps as the NBN 500 tier becomes the mainstream pick. That takes cost per Mbps from about $33 in today’s dollars in 2004 to under 20 cents.
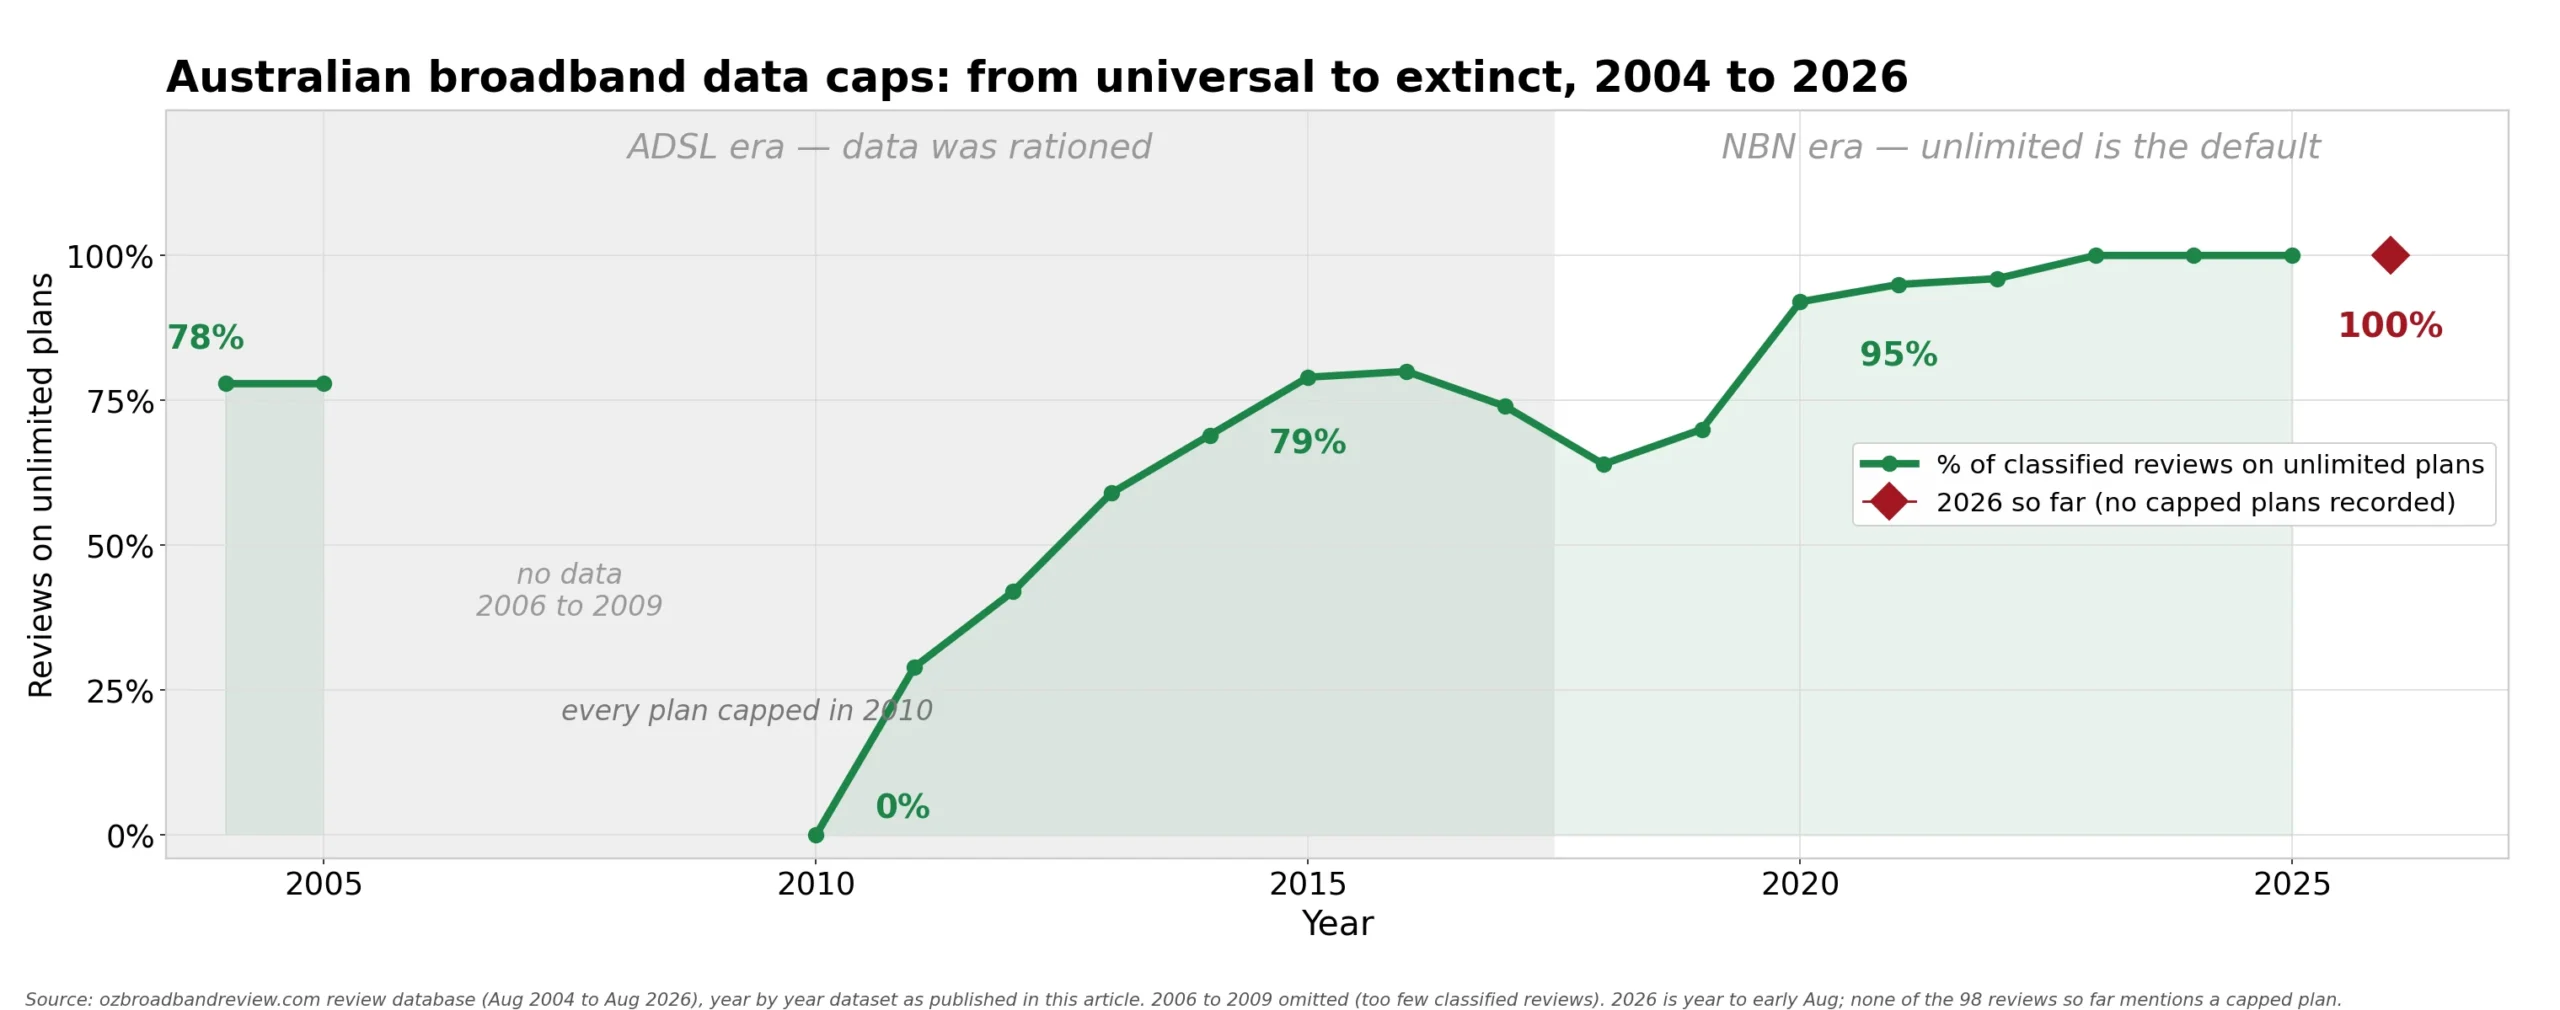
Data caps went from universal to extinct. In 2010 every plan in our database had a hard cap, with a median of 165 GB. By 2022 every classified review was on an unlimited plan. We have not recorded a single capped consumer plan since 2021. Nothing has changed in 2026: not one of the 98 reviews so far this year mentions a capped plan.
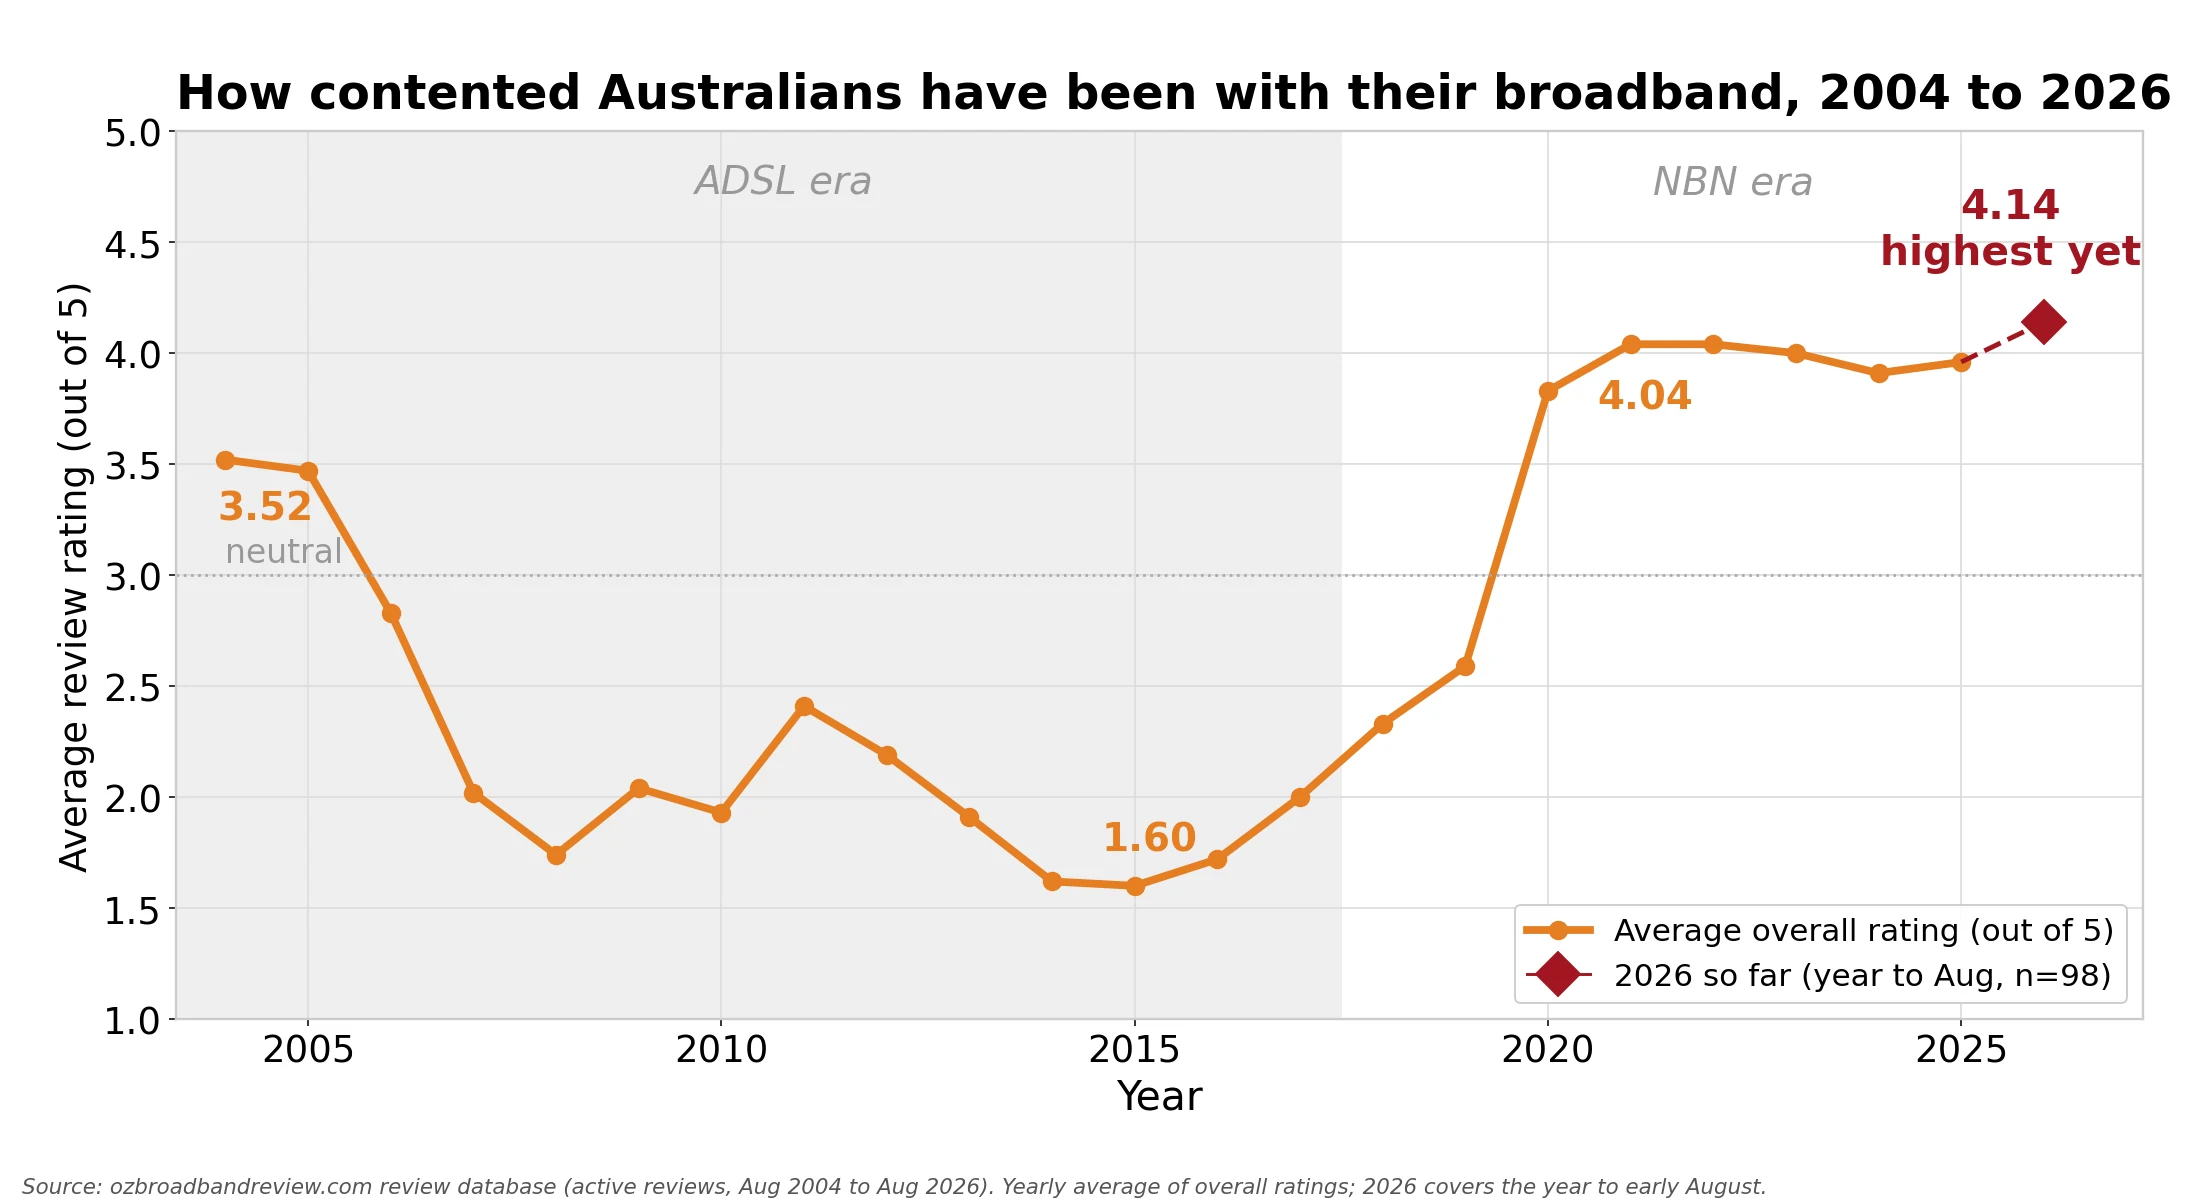
Contentment crashed during the ADSL2+ years and rebounded with the NBN. Average overall rating sat at 1.5 to 2.0 out of 5 through 2014 to 2017. From 2020 onwards it has been 3.8 to 4.1. Australian households are happier with their broadband now than they have been at any point in the last 22 years. The first 98 reviews of 2026 average 4.14 out of 5, still the highest yearly figure in the whole dataset.
The chart

Four panels, each on the same time axis. The shaded left half is the pre NBN era (2004 to 2017) and the right half is the NBN era. This summary chart runs to 2025. The individual charts higher up break each panel out in more detail and include the 2026 numbers as they come in.
The story is most visible in the contentment chart. Look at the dip from 2014 to 2017. That is the ADSL2+ misery period. Many Australians were stuck on slow copper while NBN suburbs were being rolled out around them. The slow copper plus the watching and waiting plus the perception of being ripped off (real ratings of 1.5 out of 5) drove a lot of the political pressure that shaped the NBN model we have now.
How we got the numbers
The cost figures come straight from what each reviewer told us they were paying. We excluded a small fraction with $0 entries (mostly very old reviews). Then a 3 year rolling median to smooth low sample early years, and ABS CPI to convert to 2024 to 25 dollars.
The speed figures are parsed from the plan name each reviewer wrote down. About 26 percent of reviews carry an explicit speed (eg “NBN 50”, “100/20”, “Dodo 256”). For the rest we built a provider tier lookup (Aussie Broadband Family equals NBN 100, Belong Starter equals NBN 12, and so on) plus generic tier fallbacks and pre NBN technology defaults. Final coverage on speed is 84 percent.
The data allowance figures use a much more conservative approach. We only counted reviews where the plan name itself said “unlimited” or contained an explicit GB figure (eg “200GB”). That gives us 282 classified reviews out of 1,318 (about 24 percent). The remaining 1,036 had vague plan names (“Premium”, “Family”, “Standard Plus”) that could not be safely classified without inference, so we excluded them.
The contentment figures use the 1 to 5 star overall rating each reviewer gave. That is reliable and consistent across the full 22 year window. We took the mean by year, then a 3 year rolling smoothing.
Two anomalies are worth flagging because they appear on every panel. 2020 only has 3 reviews in our active set, which is COVID plus a site change. 2021 jumped to 241 reviews, which was a relaunch plus a gift card competition. The rolling median bridges over both.
What $90 actually buys you today vs 2004
Same money in real terms. Very different product.
| What $90 (in 2026 dollars) bought | 2004 | 2026 |
|---|---|---|
| Typical down speed | About 1.5 Mbps (ADSL) | About 500 Mbps (NBN 500) |
| Typical up speed | About 0.25 Mbps | About 40 Mbps |
| Typical data quota | 10 GB to 50 GB | Unlimited |
| Latency | 60 to 100 ms to a Sydney server | 10 to 20 ms |
| Number of devices | 1 PC, maybe a laptop | 20+ |
| Netflix in 4K? | Netflix did not exist in Australia until 2015 | Yes, simultaneous on multiple TVs |
| Reliable WFH? | Not really | Yes for most jobs |
| Average overall rating | About 3.6 (small sample) | About 4.3 |
| Cost per Mbps | About $33 | About 18 cents |
The 180 times drop in cost per Mbps is the through line for the whole 22 years. Australians are buying more bandwidth for the same money, with no shaping, no caps, with better support, with more competition. The headline price has not moved.
Why it has happened
A lot has been written about each of these trends individually. Looking at them together, three things explain most of what we see.
The NBN wholesale model. Both the cost and the data allowance stories pivot on NBN Co’s pricing structure from about 2018 onwards. A flat per connection fee plus a falling bandwidth fee made unlimited an easy default and put a floor under retail prices.
The fall in transit and fibre costs. The cost of running an internet network in Australia has dropped dramatically since 2004. International bandwidth, domestic transit, fibre runs, customer modems, all cheaper in real terms. That is what made the 16 times speed improvement at flat cost possible.
Competition from the challenger ISPs. The Mate, Tangerine, Aussie Broadband, Superloop and Exetel cohort kept Telstra, Optus, TPG and iiNet honest on price across the entire decade. Every speed tier launch was followed within months by a budget challenger matching it. Without them the median bill would be a lot higher than $89.
What this means today
A few practical takeaways from the data, if you are an Australian household reading this.
If you are paying more than $90 a month for a standard NBN plan in 2026, you are paying above the OBBR median. The cheapest unlimited NBN 50 plans on our database now start at $70 a month, with intro offers from about $59. We have a savings calculator that shows you what you would save by switching. The average annual saving across 287 users who have run the calculator is $396.
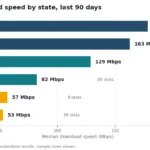
Here is where every NBN speed tier actually sits today. Unlike the chart above, which is a historical record, this one is read from our plan database on every page load, so it is the live market rather than a snapshot.
What each NBN speed tier costs right now
The cheapest, dearest and average monthly price we can find for every NBN fixed line speed tier. Same scale on every row, so you can see how much you really pay to move up a tier, and how wide the gap is between providers selling the identical connection.
Residential NBN fixed line plans only, so fixed wireless, Sky Muster and private fibre are left out. Prices are the ongoing monthly cost, not an introductory rate. Speeds are the typical evening speed providers publish under ACCC guidelines, which is why a few plans sit in a lower band than their marketing name suggests. See our current top NBN picks →
If you are on a 5G home wireless plan, check whether it has a monthly cap. Most do. 5G is the one part of the Australian broadband market where caps are still common.
If your contract is auto renewing at the post promotional rate (this happens to most households after 6 months) you are almost certainly overpaying. Switching is straightforward and we have a step by step guide for it.
If you are on FTTN and getting under 50 Mbps in the evening, you are eligible for a free NBN Co FTTP upgrade. It does require committing to NBN 100 or above but it will increase your real world speed dramatically.

|
Turtle Speed
25 Mb/s
Unlimited data
|
$64.90/mth | Go to site |

|
Value
25 Mb/s
Unlimited data
|
$42.90/mth
for 6 mths,
then $72.90/mth |
Go to site |

|
Basic - nbn 12/1
12 Mb/s
Unlimited data
|
$77/mth | Go to site |

|
Everyday
25 Mb/s
Unlimited data
|
$58/mth
for 6 mths,
then $78/mth |
Go to site |

|
One Plan
500 Mb/s
Unlimited data
|
$80/mth | Go to site |
| Click here to view more NBN plans | |||
The full year by year dataset
| Year | n | Real cost ($2025) | Plan speed Mbps | % unlimited | Overall rating |
|---|---|---|---|---|---|
| 2004 | 40 | $88 | 6 | 78% | 3.52 |
| 2005 | 9 | $86 | 6 | 78% | 3.47 |
| 2006 | 2 | $82 | 6 | n/a | 2.83 |
| 2007 | 2 | $64 | 5 | n/a | 2.02 |
| 2008 | 8 | $62 | 5 | n/a | 1.74 |
| 2009 | 3 | $75 | 6 | n/a | 2.04 |
| 2010 | 11 | $88 | 6 | 0% | 1.93 |
| 2011 | 16 | $86 | 6 | 29% | 2.41 |
| 2012 | 57 | $84 | 6 | 42% | 2.19 |
| 2013 | 63 | $96 | 12 | 59% | 1.91 |
| 2014 | 108 | $94 | 18 | 69% | 1.62 |
| 2015 | 95 | $92 | 18 | 79% | 1.60 |
| 2016 | 89 | $91 | 18 | 80% | 1.72 |
| 2017 | 69 | $90 | 18 | 74% | 2.00 |
| 2018 | 36 | $94 | 18 | 64% | 2.33 |
| 2019 | 38 | $93 | 50 | 70% | 2.59 |
| 2020 | 3 | $91 | 50 | 92% | 3.83 |
| 2021 | 241 | $90 | 50 | 95% | 4.04 |
| 2022 | 137 | $87 | 50 | 96% | 4.04 |
| 2023 | 46 | $84 | 50 | 100% | 4.00 |
| 2024 | 35 | $87 | 50 | 100% | 3.91 |
| 2025 | 38 | $89 | 100 | 100% | 3.96 |
| 2026* | 98 | $87 | 500 | 100% | 4.14 |
*2026 covers the year to early August. Cost is the median quoted price converted to 2024 to 25 dollars using the 3.8% CPI rise to the June quarter 2026 (ABS). Speed uses the structured plan speed field, reported by 46 of the 98 reviewers. Not one 2026 review mentions a capped plan.
Suggested credit if you reuse this: “Source: ozbroadbandreview.com 22 year review dataset (1,200+ active reviews, August 2004 to August 2026). Cost adjusted via ABS Catalogue 6401.0.”
Reusing this data
This is the only continuous record of Australian household broadband prices, speeds, data allowances and customer ratings going back to 2004 that we know of. If you are a journalist, student, researcher, or industry analyst we are happy for you to use it.
Suggested credit line:
Source: ozbroadbandreview.com 22 year review dataset (1,200+ active reviews, August 2004 to August 2026). Cost adjusted via ABS Catalogue 6401.0. Available at https://www.ozbroadbandreview.com/blog/22-years-of-australian-broadband/
Want the raw data? The aggregated year by year table above is reusable as is. If you need access to the underlying record level data (eg for academic research, an industry report, or a journalism investigation) we can usually share it on request. Hit us up via the contact page with a one line description of what you are working on and we will sort it out.
The dataset is licensed for use under attribution. We just ask that you credit ozbroadbandreview.com clearly and link back to this article so readers can check the methodology and the year by year numbers themselves.
Frequently asked questions
How much did broadband cost in Australia in 2004 vs 2026?
The median Australian reviewer in 2004 paid $50 a month, which is about $88 in 2024 to 25 dollars after inflation. The median 2025 reviewer paid $89 a month, and the 2026 median so far is $90. Real prices have not moved in 22 years; with CPI running at 3.8%, right now they are falling.
When did the NBN actually become useful?
The NBN rollout reached enough households to dominate our review record in 2018. NBN 50 (Standard Plus) became the default tier. The median plan speed in our reviews jumped from 18 Mbps in 2017 to 50 Mbps in 2019, the biggest year on year jump in 22 years of data.
When did unlimited NBN plans become common?
The first wave was 2012 to 2015 when TPG launched a $50 unlimited ADSL2+ plan and the rest of the market followed. The second wave was 2018 onwards when NBN Co’s wholesale pricing made unlimited the easy default. By 2022 every classified review in our data was on an unlimited plan.
Are there still capped NBN plans in 2026?
Almost no consumer NBN plans have hard data caps in 2026, and not one of the 98 reviews we have received this year mentions one. The capped products that remain are mostly 4G and 5G home wireless and business plans. Our review database has not recorded a capped consumer plan since 2021.
Has Australian broadband become cheaper?
In nominal terms, no. In real terms (after CPI), it is roughly the same as 2004. What has changed is how much you get for your money. Median speed has gone up 16 times. Data caps have gone from universal to gone. Customer satisfaction has roughly doubled.
Why was customer satisfaction so low during the ADSL2+ years?
A combination of three things. Speeds were stuck around 5 to 18 Mbps in real terms while expectations were rising. Hard caps were common and irritating. And the NBN was being rolled out around Australians who could not yet get it, which made the gap between what was possible and what was available feel personal.
How much data does an average Australian household use today?
About 470 GB per month, according to the ACCC’s Measuring Broadband Australia program, which published its final report in June 2026. That is more than the median data cap on plans as late as 2014. If caps were still the norm the typical household would be over their limit by mid month.
What is the cheapest NBN plan available right now?
As of August 2026 the cheapest unlimited NBN plans in our database sit between $45 and $65 a month, mostly for NBN 12 and NBN 25, with unlimited NBN 50 from about $70. We maintain a live list at 10 Cheapest Unlimited NBN Plans that updates as prices change.
What is the methodology behind these numbers?
Every figure comes from our public review database, where Australian users have submitted reviews of their broadband providers since August 2004. Cost from what each reviewer reported paying each month. Speed parsed from the plan name each reviewer wrote, using a provider tier lookup plus pre NBN defaults (84 percent coverage). Data allowance from explicit GB figures or the word ‘unlimited’ in the plan name (24 percent coverage). Contentment from the 1 to 5 star overall rating each reviewer gave. All figures use a 3 year rolling median for smoothing. CPI from ABS Catalogue 6401.0.
Can journalists reuse this data?
Yes, with attribution to ozbroadbandreview.com. The 22 year longitudinal dataset is unique to OBBR. Suggested credit line is ‘Source: ozbroadbandreview.com 22 year review dataset (1,200+ reviews, August 2004 to August 2026).’
What is OBBR?
ozbroadbandreview.com is an independent Australian broadband comparison and review site that has been running since August 2004. We compare NBN, 5G home wireless and satellite plans, host real Australian user reviews, and maintain a savings calculator at /savemoney.php. All affiliate relationships are disclosed on our affiliate page.
Sources
Internal data: ozbroadbandreview.com review database (1,200+ active reviews submitted between August 2004 and August 2026).
External data: ABS Catalogue 6401.0, Consumer Price Index, Australia, for inflation adjustment. ACCC Measuring Broadband Australia for delivered speeds and average household data usage. NBN Co tier launch announcements for the fastest available reference (NBN 100 at 2011 launch, NBN 250 and NBN 1000 in September 2020, NBN 2000 in 2024).