Last updated: 22 August 2026
A reference page for current Australian NBN, broadband and mobile statistics. Sourced from NBN Co’s published financial results, the ACCC’s quarterly NBN Wholesale Market Indicators report, the ACCC’s Measuring Broadband Australia program (which published its final report in June 2026), ACMA’s Communications Report, Speedtest Global Index data and ABS releases. Every figure on this page is tied to a primary source listed at the bottom. Use any of these numbers in your own work as long as you credit the page.
Citing these stats?
Anyone is welcome to use the figures on this page in articles, reports, presentations or research. We just ask for a link back to the site so readers can find updates and the rest of our broadband coverage.
Suggested credit (HTML):
Source: <a href="https://www.ozbroadbandreview.com">Oz Broadband Review</a>Or in plain text: Source: Oz Broadband Review. Ozbroadbandreview.com
The headline numbers
| Metric | Figure | As of | Source |
|---|---|---|---|
| NBN premises ready to connect | ~12.5 million | December 2025 | NBN Co FY26 Half Year Results |
| NBN active services (residential + business) | ~8.8 million | March 2026 quarter | ACCC NBN Wholesale Market Indicators |
| NBN 50 share of active services | ~30% | March 2026 quarter | ACCC NBN Wholesale Market Indicators |
| NBN 100 share of active services | ~8% (most NBN 100 services were upgraded to NBN 500 in late 2025) | March 2026 quarter | ACCC NBN Wholesale Market Indicators |
| Above 100 Mbps share of active services | ~34% (NBN 250, 500 and 1000 combined) | March 2026 quarter | ACCC NBN Wholesale Market Indicators |
| FTTP share of access technology mix | ~36% | March 2026 quarter | ACCC NBN Wholesale Market Indicators |
| Australia’s global rank — fixed broadband | ~21st | Speedtest Global Index, 2025–26 | Ookla Speedtest Global Index |
| Australian median fixed download speed | ~120–135 Mbps | Speedtest Global Index, 2025–26 | Ookla Speedtest Global Index |
| 3G shutdown — Telstra and Optus | October 2024 | October 2024 | ACMA, carrier announcements |
| 3G shutdown — Vodafone (TPG) | January 2025 | January 2025 | Carrier announcement |
The rest of this page breaks the numbers down by topic, with the source for every figure called out alongside it. Every percentage and dollar value here is rounded to avoid false precision. If you need the exact figure to two decimal places, the source documents are linked at the bottom.
NBN active services by connection type
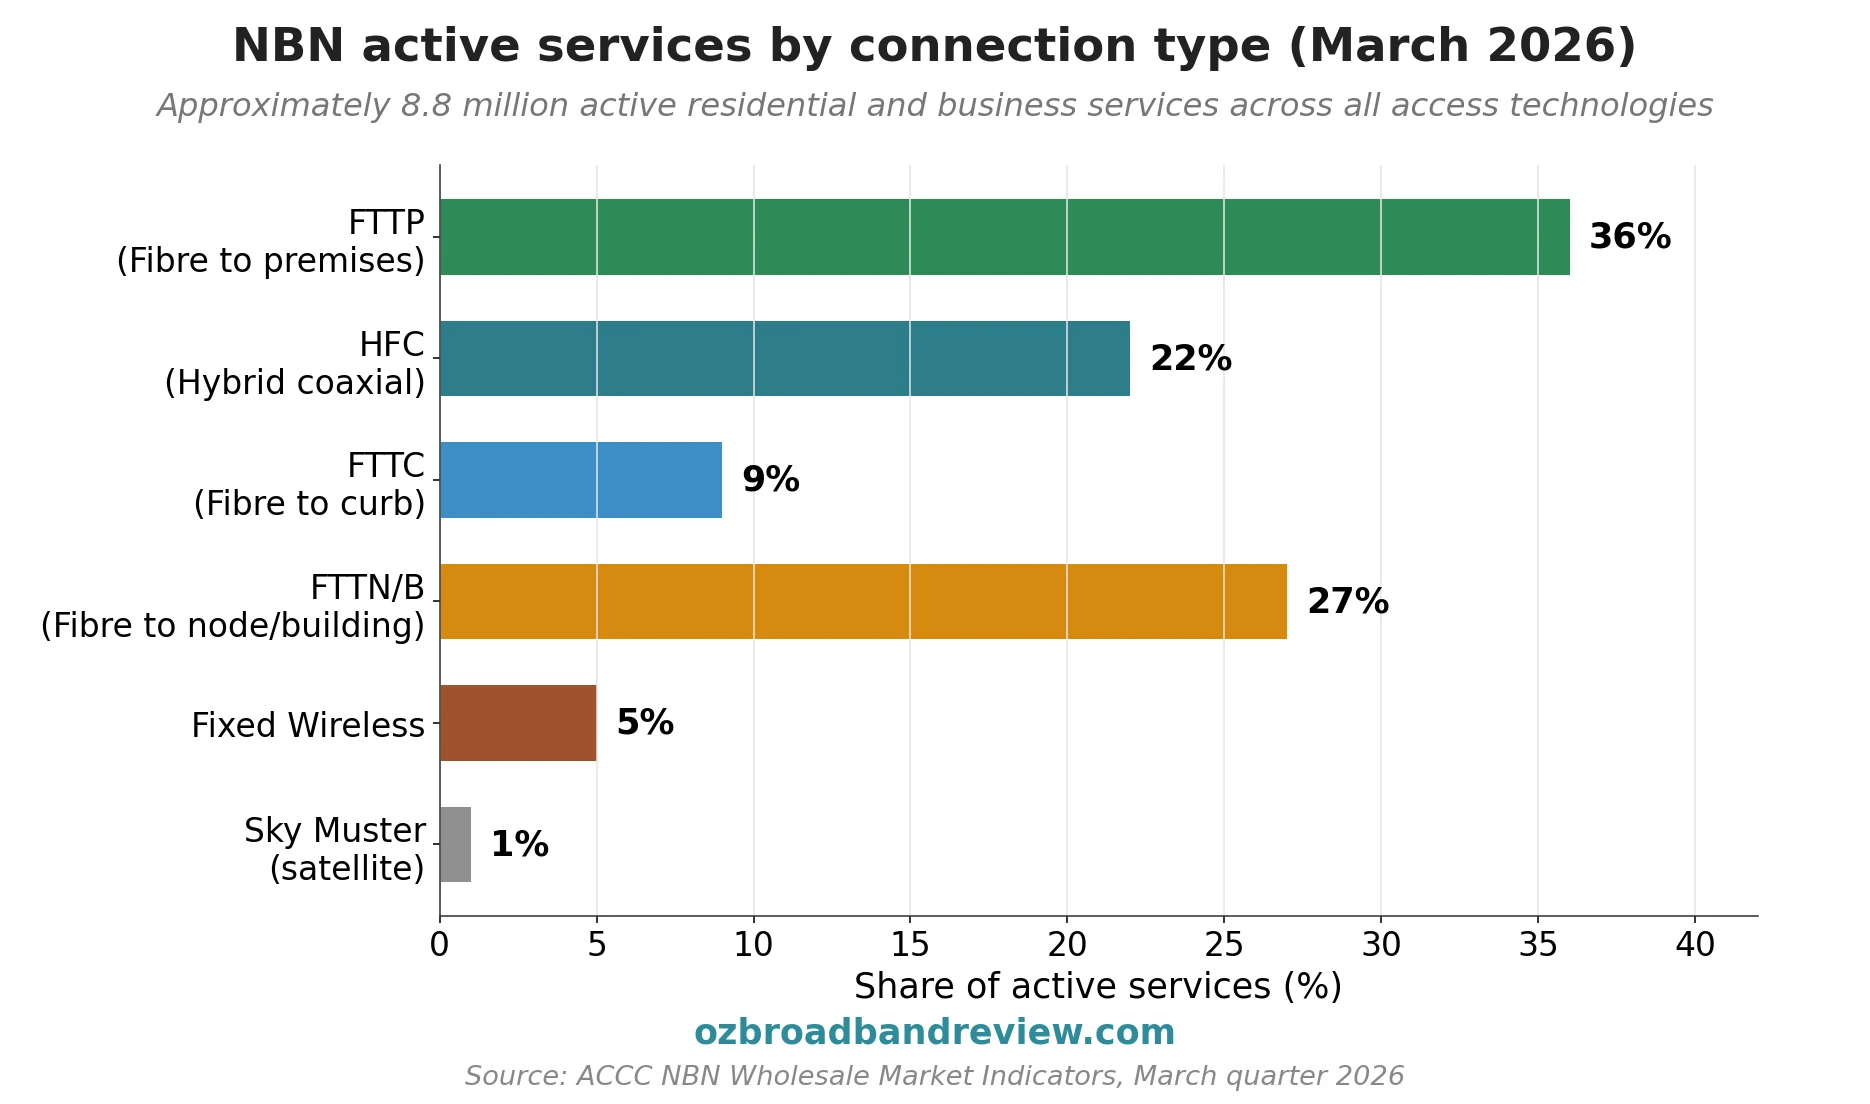
The NBN runs on a multi technology mix. The split as of March 2026 (approximate, rounded):
- FTTP (Fibre to the Premises): ~36% — the fastest access tier and the one expanding fastest under the Fibre Connect upgrade program
- FTTN/B (Fibre to the Node/Building): ~27% — declining share as premises are upgraded to FTTP
- HFC (Hybrid Fibre Coaxial): ~22% — repurposed cable TV infrastructure, capable of NBN 1000 and now NBN 2000
- FTTC (Fibre to the Curb): ~9% — fibre to the kerb pit, copper for the last drop. Share is falling as FTTC premises move to FTTP.
- Fixed Wireless: ~5% — regional homes connected via NBN towers
- Sky Muster (satellite): ~1% — remote homes
The FTTP share keeps climbing: on the ACCC’s count, FTTP passed 3.2 million active services in March 2026, up about 24% in a year. Under the Fibre Connect program, NBN Co and the Australian Government have committed a joint investment of approximately $3.8 billion to upgrade most remaining FTTN premises to FTTP by 2030, alongside parallel FTTC upgrade programs. Source: ACCC NBN Wholesale Market Indicators; NBN Co FY26 Half Year Results media release.
NBN active services by wholesale speed tier
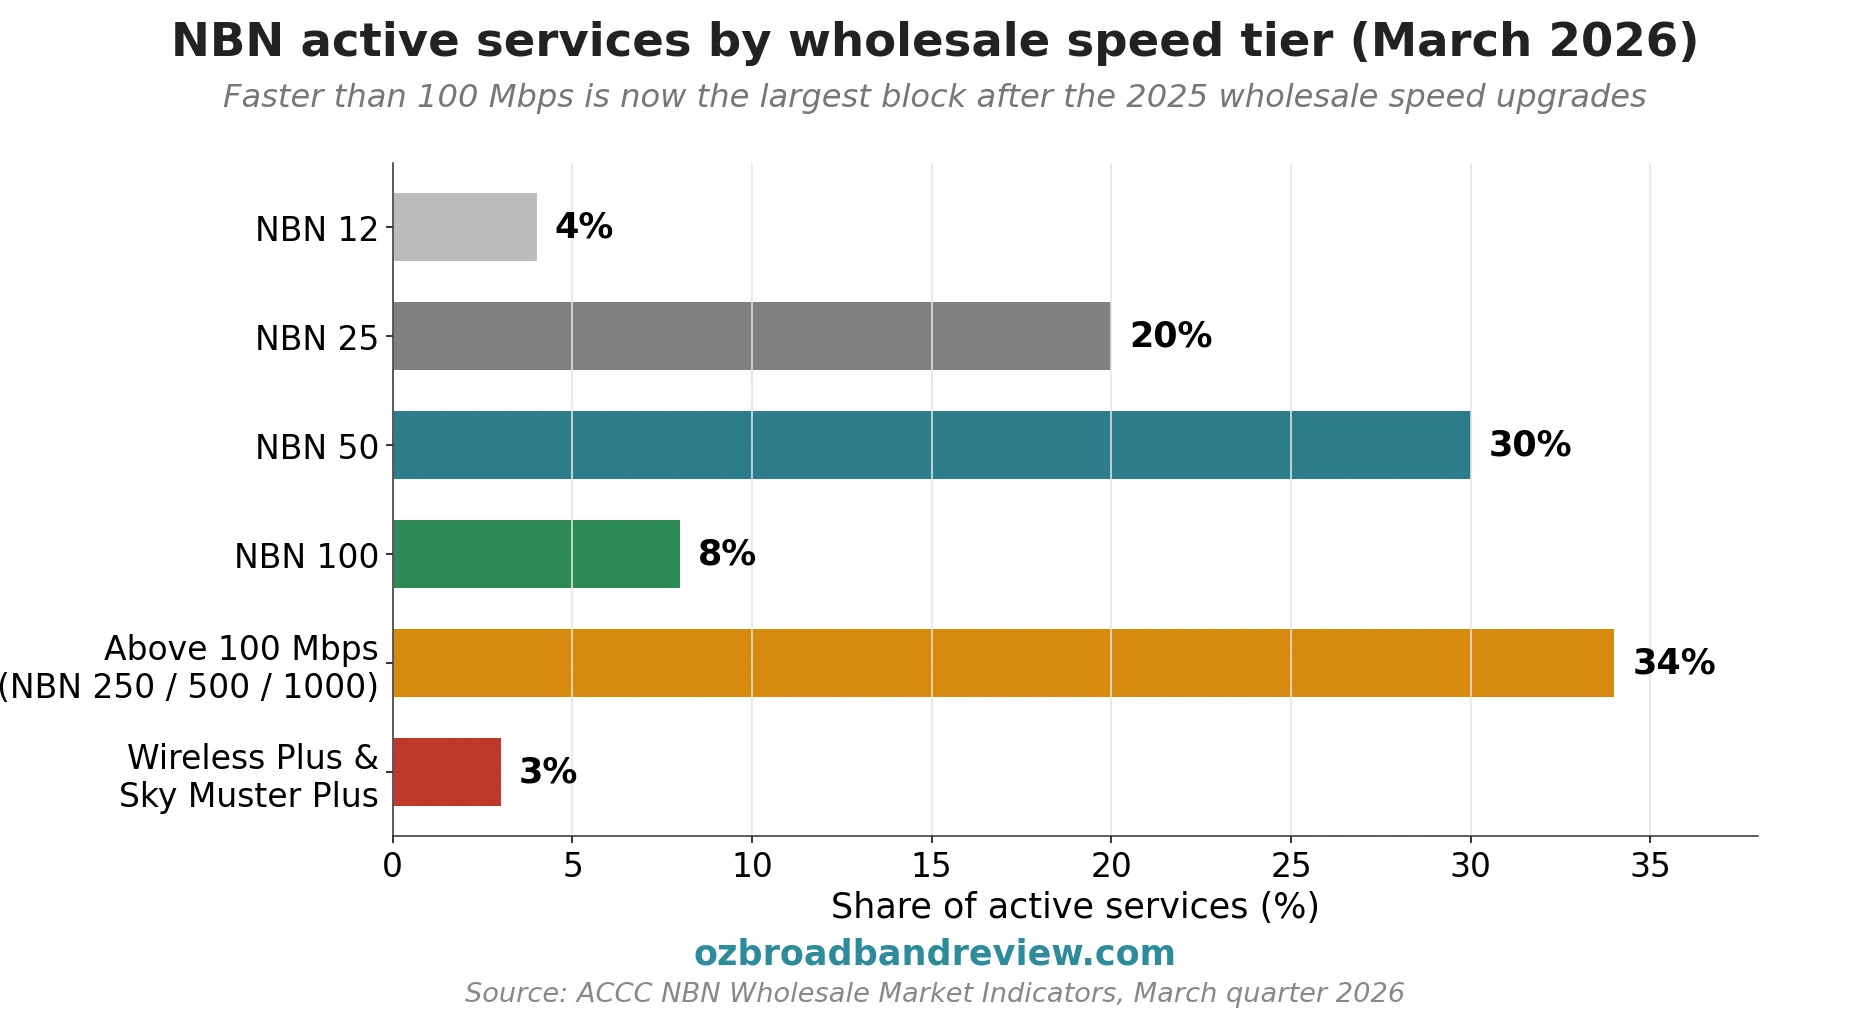
The mix changed dramatically in late 2025, when NBN Co’s wholesale speed upgrades moved most NBN 100 (and many NBN 250) customers onto 500 Mbps and faster products at no extra wholesale cost. Tiers above 100 Mbps are now the single largest block, and NBN 50 is no longer half the market.
- Above 100 Mbps (NBN 250, 500 and 1000) — ~34% of active services
- NBN 50 — ~30%
- NBN 25 — ~20%
- NBN 100 — ~8%
- NBN 12 — ~4%
- Wireless Plus and Sky Muster Plus — ~3%
Source: ACCC NBN Wholesale Market Indicators, March quarter 2026. Figures rounded to whole percentages.
Real world speeds delivered (ACCC MBA final report)
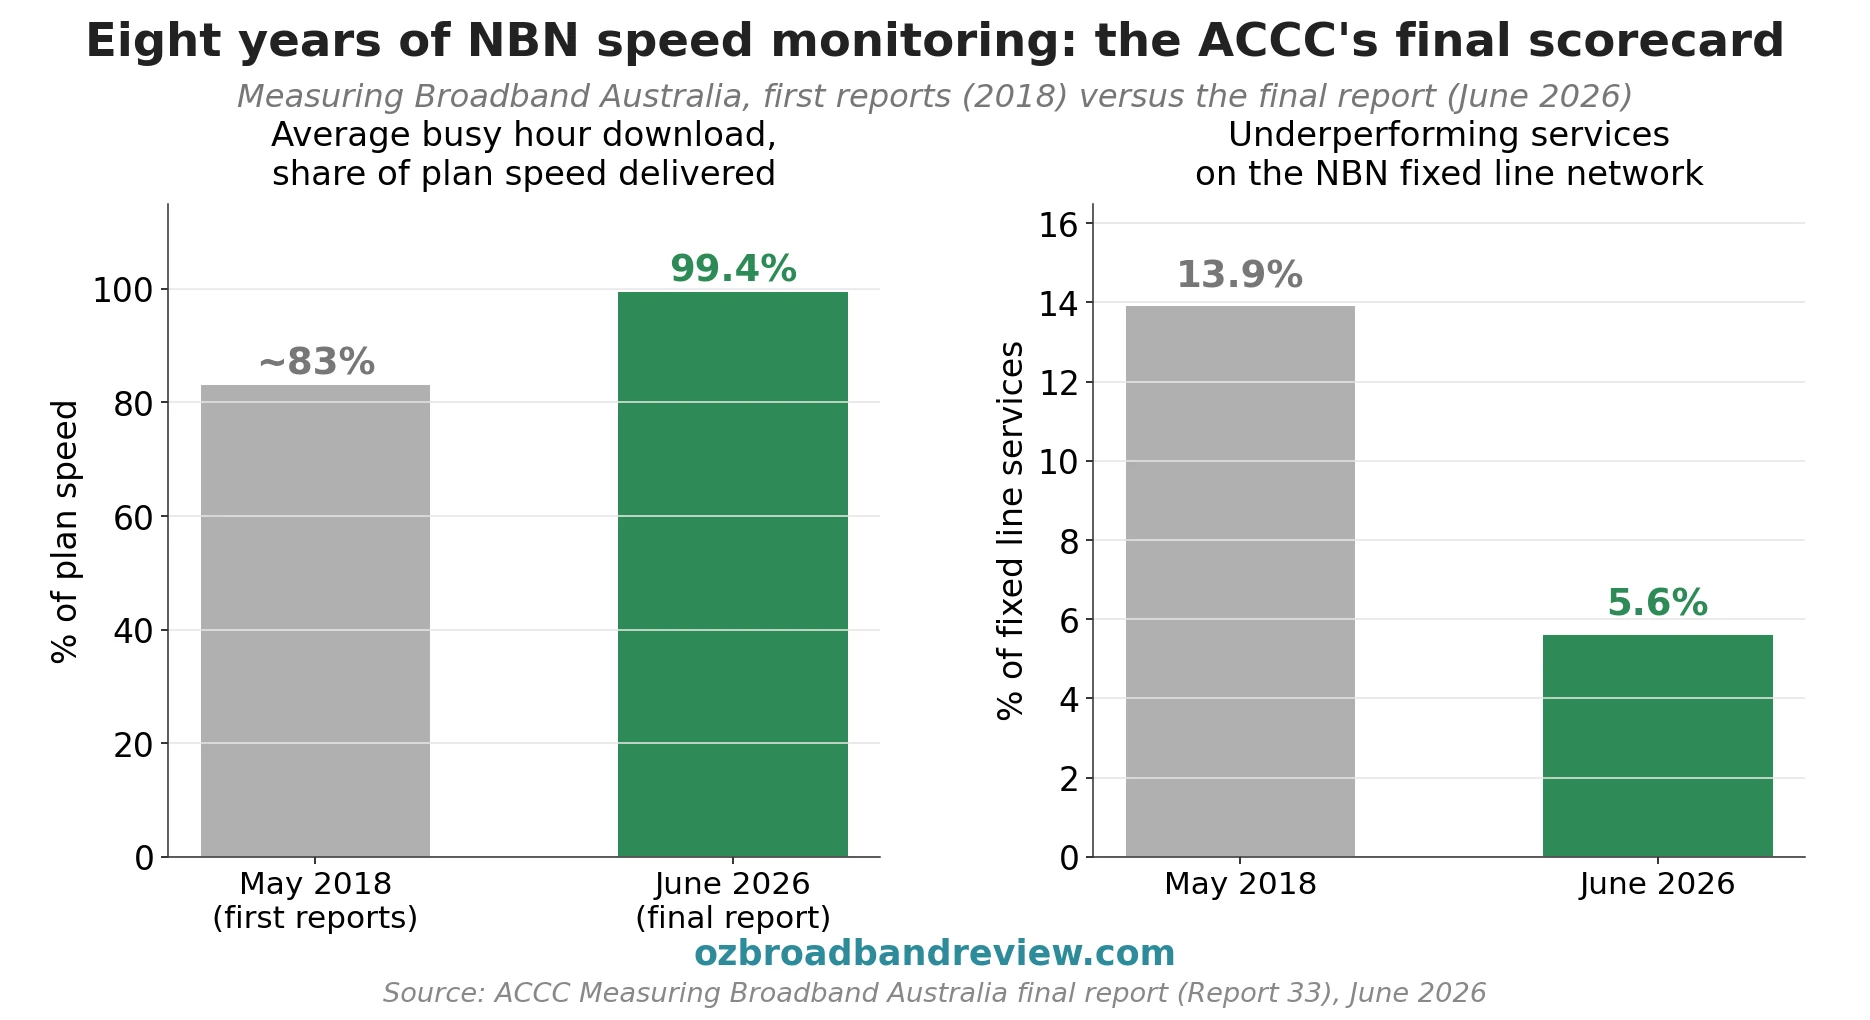
The ACCC’s Measuring Broadband Australia (MBA) program tracked the speeds paying customers actually received on the NBN from 2018 until 30 June 2026, when the program wound up after its 33rd and final report. The final scorecard, published 17 June 2026:
- Fixed line NBN services delivered an average of 99.4% of plan download speed during the 7–11pm busy hours, up from 80 to 85% in the first 2018 reports
- Underperforming services fell from 13.9% of fixed line services in May 2018 to 5.6% in the final report
- NBN Fixed Wireless Home Fast averaged 160.5 Mbps down and 12.6 Mbps up in busy hours; Fixed Wireless Plus delivered close to 100 Mbps
- The ACCC will keep watching performance through provider record keeping rules, but there is no longer an independent household measurement program
With MBA gone, independent measurement now rests on long running first party datasets. Our own speed test and live statistics page carry that record forward. Source: ACCC Measuring Broadband Australia final report (Report 33), June 2026.
How Australia compares globally
From Ookla’s Speedtest Global Index data (a real time aggregation of consumer speed tests):
- Australia’s median fixed broadband download speed: around 120–135 Mbps as of 2025–26 (figure has trended up as more households move to NBN 100+ and gigabit tiers)
- Australia’s global rank for fixed broadband: typically ~21st over recent quarters
- Singapore consistently ranks #1 (median fixed download often over 300 Mbps)
- Australia’s median mobile download: around 85–100 Mbps (typically top 15 globally for mobile)
For the full international comparison and historical trend, see our Australia’s internet speed rankings deep dive. Source: Ookla Speedtest Global Index.
Mobile, 5G and the 3G shutdown
- Smartphone penetration in Australia: ~98% of adults (ACMA Communications Report)
- Fixed line voice (PSTN/VoIP) use: ~15% of Australians made fixed line voice calls by the end of 2024 — most communication has moved to mobile and OTT messaging (ACMA, BuddeComm)
- Telstra 3G shutdown: 28 October 2024
- Optus 3G shutdown: 28 October 2024
- Vodafone/TPG 3G shutdown: 31 January 2025
- 5G coverage (Telstra): ~90% of the population by late 2025 (Telstra disclosures)
- 5G coverage (Optus): ~83% of the population by late 2025 (Optus disclosures)
- 5G home wireless: actively marketed by Telstra, Optus and TPG as a fixed line alternative; combined subscriber base in the hundreds of thousands of services nationally
Source: Australian Communications and Media Authority (ACMA) Communications Report; ACMA Communications and media in Australia: How we communicate; carrier media releases.
Market structure: who sells NBN to consumers
NBN Co is the wholesale only network operator. Consumer plans are sold by retail service providers (RSPs), of which there are over 100 in Australia. The ACCC publishes wholesale access seeker numbers every quarter. As of March 2026 (services in operation, ACCC NBN Wholesale Market Indicators):
- Telstra — ~3.14 million services (about 36%)
- TPG Telecom group — ~1.55 million (includes the TPG, iiNet and Internode brands)
- Optus — ~1.08 million
- Vocus group — ~0.88 million (includes Dodo and iPrimus)
- Aussie Broadband — ~0.80 million, Australia’s largest independent retailer
- Superloop — ~0.71 million, the fastest grower of the big seven over the past two years
One caveat: these are wholesale counts, so smaller brands that buy NBN through an aggregator are counted under the aggregator rather than their own name. The trend is clear all the same. Telstra’s share keeps drifting down (it was about 40% two years ago) while Superloop, Vocus and Aussie Broadband keep climbing. Source: ACCC NBN Wholesale Market Indicators, March quarter 2026.
The free FTTP upgrade program
- NBN Co’s Fibre Connect program offers a free FTTP upgrade to eligible FTTN, FTTC and FTTB premises when the customer signs up to an eligible plan (typically NBN 100 or higher)
- Joint investment by NBN Co and the Australian Government: ~$3.8 billion
- Target: most remaining FTTN and FTTC premises to be upgraded to FTTP by 2030
- Cumulative FTTP upgrades under the program: more than 1 million premises by December 2025, with FTTP active services reaching 3.2 million on the ACCC’s March 2026 count
- Upgrade pace has been around 200,000+ premises per financial half year
Source: NBN Co FY26 Half Year Results media release and accompanying CEO speech.
Other useful Australian internet figures
- Most Australian NBN plans in the budget tier sit in the range $85–$97 per month for unlimited NBN 50, with intro pricing as low as $58 for the first 6 months from some providers (varies by quarter)
- Average household data usage on a fixed line NBN connection: approximately 500 GB to 1.5 TB per month for streaming households (industry telemetry; varies widely)
- NBN 2000 (2 Gbps wholesale speed): launched on HFC during 2025 to selected premises; available on a small number of premium plans from major providers
- Sky Muster Premium Plus: offers wholesale download speeds up to 100 Mbps with higher data allowances than legacy Sky Muster (source: NBN Co Sky Muster product pages)
Where these statistics fit in our wider coverage
- NBN Plans in Australia — every speed tier explained
- What internet speed do I need?
- Australia’s internet speed rankings (global)
- History of the internet in Australia (1989–today)
- Different types of NBN connections
- Cheapest unlimited NBN plans (live data)
- 5G in Australia
Primary sources used on this page
All figures above are drawn from one or more of the following primary sources, listed alphabetically by publisher. We update this page as each new release is published.
- Australian Bureau of Statistics (ABS) — Internet activity and household use of information technology releases. abs.gov.au
- Australian Communications and Media Authority (ACMA) — annual Communications Report and Communications and media in Australia series, covering mobile, fixed line, voice and messaging trends. ACMA — How we communicate
- Australian Competition and Consumer Commission (ACCC) — Measuring Broadband Australia (MBA) reports, concluded with the final Report 33 in June 2026, plus the quarterly NBN Wholesale Market Indicators report. ACCC MBA program
- BuddeComm (Paul Budde Research) — Australia: Telecoms, Mobile and Broadband Statistics and Analyses. budde.com.au
- NBN Co — Half Year and Full Year Results media releases, CEO speeches, wholesale market dashboard. NBN Co media centre
- NBN Co FY26 Half Year Results — most recent half year disclosure available, used for FTTP upgrade progress and active service figures throughout this page. NBN Co media centre
- Ookla Speedtest Global Index — monthly aggregated speed test data by country. speedtest.net/global-index
- Telstra, Optus, TPG investor and ASX disclosures — half year and full year financial results contain disclosed subscriber and coverage figures.
How we curate these figures. Every statistic on this page comes from one of the primary sources listed. Where rounded figures appear (e.g. “~30%”), the underlying source figure is reported to greater precision in the linked document. Where ranges appear (e.g. “120–135 Mbps”), the figure has moved within that range across recent quarterly releases. We avoid including statistics that haven’t appeared in a primary disclosure. If you spot a figure on this page that looks out of date, please get in touch via the site contact form. NBN Co reports every six months, the ACCC’s Wholesale Market Indicators lands quarterly, and the MBA program wrapped up in June 2026. We update the page as new releases land.
Reusing these statistics
Anyone is welcome to use the figures on this page in articles, reports, presentations, research or social media. We just ask that you credit Oz Broadband Review with a link back to the main site so readers can find the original source and any subsequent updates.
Suggested credit, in HTML:
Source: <a href="https://www.ozbroadbandreview.com">Oz Broadband Review</a>In plain text:
Source: Oz Broadband Review. Ozbroadbandreview.com
Or simply: (via Oz Broadband Review).
If you’re writing for a news outlet or producing research and want to confirm a figure with a primary source before publication, the source list above tells you exactly where each number on this page came from.